Using Math to hide Vaccine Failure
According to the Alberta Government the vaccines work. As proof they show this on their website.
- 67.4% of COVID-19 deaths (1,133/1,680) since Jan 1, 2021 were unvaccinated or diagnosed within two weeks from the first dose immunization date
This makes us believe that many more unvaccinated people die of covid than vaccinated and therefore the vaccines work. That is not true, by starting in January and giving the 2 week grace period for the vaccine they are just using math to trick you.
Before we get in to the mathematical illusion I want to pause so you can consider the following questions. If the vaccines work, why is anyone dying of COVID? Shouldn’t we see 100% of COVID deaths occurring in unvaccinated people?
Now back to our prime concern, using math to hide the truth. The vaccines do 2 things that obscure the truth.
- They are effective at preventing COVID deaths for a very short time.
- They turn Vaccinated people in to super spreaders. For a short period there is a surge in infections and deaths of unvaccinated people. This surge is caused by the vaccine.
So let’s do this hypothetical exercise. Let’s say that in the 2 months after vaccination no vaccinated people die but the vaccines cause 1000 unvaccinated people to get infected and die. After that no more unvaccinated people die but 20 vaccinated people die every week. So after 6 months (26 weeks) 1000 unvaccinated people died and 520 vaccinated people died. Keep in mind all the unvaccinated people died right at the beginning. Here is what that looks like when we calculate the percentage of people dying from COVID using the total since start of vaccination.
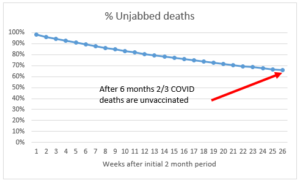
Using this data the Alberta government would tell you that the vaccines work because only 33% of COVID deaths are vaccinated people, even though 100% of COVID deaths in the last 6 months were vaccinated people. So does the vaccine work because only 67% of deaths are unvaccinated or have they failed because 100% of people dying now are vaccinated?
It should be obvious from my hypothetical example that the percentage you calculate at any given time is irrelevant. The only important consideration should be whether the percentage changes with time as it did in my example. The Alberta government updates these numbers daily but they do not show the history. They do not publish the history because it would show the percentage changing with time and not in a way that makes the vaccines look effective.
I wish I could say that I have been tracking these numbers but I have not. I simply have not been able to anticipate all the different ways government will lie to us. Thankfully there are people cleverer than me and they have been tracking these numbers. A friend of mine sent me these numbers from an Irish blogger.
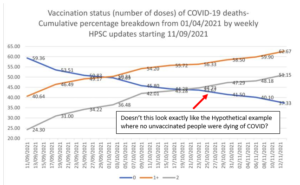
The vertical axis is the % of people dying of COVID for each group. The blue line is unvaccinated, orange is 1 dose, and grey is 2 doses (fully vaccinated). They are using a cumulative % from the start of the vaccination program just like my hypothetical example. The cumulative percentage for the unvaccinated group drops every week just as it did in my example. This means that with every passing week more vaccinated people die from COVID than unvaccinated. In fact for the last week of the data only vaccinated people died of COVID.
The Irish and Alberta Governments want you to believe the vaccines work even though every week far more vaccinated people die from COVID than Unvaccinated people. Some weeks 100% of COVID deaths are vaccinated. I don’t know about you but I don’t find this to be compelling evidence of vaccine effectiveness.